
Loguru is a third-party logging library for Python. Instead of the handlers and formatters the standard logging module needs, it gives you one ready-made logger and a single add() call for each place your logs should go.
This guide covers installing Loguru, setting the level, writing to files, JSON output, adding context to each line, logging exceptions, using Loguru alongside the logging module, and sending Loguru logs to OpenTelemetry.
Key takeaways
from loguru import loggeris the whole setup;logger.add()adds sinks such as files.rotationandretentionon a file sink keep log files from filling the disk.serialize=Truewrites JSON lines that log search tools can filter field by field.- Add production sinks with
diagnose=Falseso tracebacks don't print passwords and tokens. - In a package other people install, log with the standard
loggingmodule; use Loguru in your own apps.
01 · Basics
Get started with Loguru
Install Loguru with pip, then import logger and start logging. Loguru prints colored lines to your terminal out of the box:
pip install logurufrom loguru import logger
logger.debug("Starting worker")
logger.info("Processed {} orders in {:.1f}s", 42, 1.234)
logger.warning("Disk usage at {percent}%", percent=91)2026-10-22 20:37:59.500 | DEBUG | __main__:<module>:3 - Starting worker
2026-10-22 20:37:59.500 | INFO | __main__:<module>:4 - Processed 42 orders in 1.2s
2026-10-22 20:37:59.500 | WARNING | __main__:<module>:5 - Disk usage at 91%
A {} in the message is filled with the next argument, and {percent} with the argument named percent.
02 · Configure
Levels, files and formats
Loguru calls each place it writes logs to a sink. A fresh logger has one sink, your terminal. logger.add() adds a sink and logger.remove() takes sinks away.
Set the log level
The terminal sink shows every level from DEBUG up. To show less, remove it and add it back with the level you want:
import sys
from loguru import logger

logger.remove()                       # remove the default terminal sink
logger.add(sys.stderr, level="INFO")  # add it back, INFO and above

logger.debug("Hidden")
logger.info("Shown")
2026-10-22 20:37:59.561 | INFO | __main__:<module>:8 - Shown logger.remove() with no arguments removes every sink. To change the level without touching code, start the app with the environment variable LOGURU_LEVEL=INFO.
Loguru levels
Each level has a number. A sink shows its own level and every level with a higher number. The numbers match Python's standard logging module, plus TRACE and SUCCESS.
| Level | No. | Method |
|---|---|---|
| TRACE | 5 | logger.trace() |
| DEBUG | 10 | logger.debug() |
| INFO | 20 | logger.info() |
| SUCCESS | 25 | logger.success() |
| WARNING | 30 | logger.warning() |
| ERROR | 40 | logger.error() |
| CRITICAL | 50 | logger.critical() |
To add your own level, give it a name and a number. 35 puts it between WARNING and ERROR:
from loguru import logger

logger.level("AUDIT", no=35, color="<magenta>")
logger.log("AUDIT", "Role changed for user {}", 1042)
2026-10-22 20:37:59.616 | AUDIT | __main__:<module>:4 - Role changed for user 1042Write logs to a file
Pass a file path to logger.add(). Loguru can also start a new file when the current one gets big, delete old files and compress them:
from loguru import logger

logger.add(
    "logs/app.log",
    rotation="100 MB",    # start a new file once this one reaches 100 MB
    retention="14 days",  # delete rotated files older than 14 days
    compression="gz",     # gzip each rotated file
)
logger.info("Written to the terminal and to logs/app.log")
rotation also takes a time of day, such as "00:00" for a new file every midnight, or an interval such as "1 week".
Change the format
The format argument sets what each line shows. Names in braces are filled in for every line, and tags like <green> add color. Loguru leaves the colors out when it writes to a file.
import sys
from loguru import logger

logger.remove()
logger.add(sys.stderr, format="<green>{time:HH:mm:ss}</green> | <level>{level: <8}</level> | {message}")
logger.info("User signed in")
20:37:59 | INFO | User signed in03 · Structure
JSON logs and context
JSON output with serialize=True
Log search tools can filter JSON field by field, which plain text does not allow. Add a sink with serialize=True and each line comes out as a JSON object with everything Loguru knows about the call (trimmed here):
import sys
from loguru import logger

logger.remove()
logger.add(sys.stdout, serialize=True)
logger.info("Payment captured"){"text": "2026-10-22 20:40:30.469 | INFO | __main__:<module>:6 - Payment captured\n",
"record": {"elapsed": {...}, "exception": null, "extra": {}, "file": {...},
"function": "<module>", "level": {"icon": "ℹ️", "name": "INFO", "no": 20},
"line": 6, "message": "Payment captured", "module": "app", "name": "__main__",
"process": {...}, "thread": {...}, "time": {...}}}If you send your logs to an observability tool, the OpenTelemetry setup below sends these fields for you.
Add context with bind() and contextualize()
Context is extra data that travels with a log line, such as a user name or a request ID. Loguru keeps it in a dict called extra and gives you two ways to fill it:
logger.bind()returns a copy of the logger with fixed values. Lines logged through the copy carry them, and the plainloggerstays as it was.logger.contextualize()adds values to every line logged inside awithblock, including lines from the functions it calls.
import sys
from loguru import logger

logger.remove()
logger.add(sys.stderr, format="{level: <7} | {message} | {extra}")

log = logger.bind(user="ada")
log.info("Signed in")


def charge_card():
    logger.info("Charging card")


with logger.contextualize(request_id="req_9f2c"):
    logger.info("Request started")
    charge_card()

logger.info("Request finished")
INFO | Signed in | {'user': 'ada'}
INFO | Request started | {'request_id': 'req_9f2c'}
INFO | Charging card | {'request_id': 'req_9f2c'}
INFO | Request finished | {} contextualize() values stay with the thread or asyncio task that set them, so in a web app, requests handled at the same time keep their own request IDs.
04 · Errors
Log exceptions with their variables
@logger.catch logs any exception the function raises, with its traceback, and lets the program carry on. Loguru's tracebacks also show the value of each variable in them:
from loguru import logger


@logger.catch
def main():
    order = {"id": "ord_123", "total": 40, "quantity": 0}
    print(order["total"] / order["quantity"])


main()
2026-10-22 18:38:39.486 | ERROR | __main__:<module>:10 - An error has been caught in function '<module>', process 'MainProcess' (14), thread 'MainThread' (281473511032000):
Traceback (most recent call last):
> File "/srv/app/main.py", line 10, in <module>
main()
└ <function main at 0xffffa7f73110>
File "/srv/app/main.py", line 7, in main
print(order["total"] / order["quantity"])
│ └ {'id': 'ord_123', 'total': 40, 'quantity': 0}
└ {'id': 'ord_123', 'total': 40, 'quantity': 0}
ZeroDivisionError: division by zero
Inside an except block, logger.exception("Charge failed") does the same for the exception you caught.
Hide variable values in production
They can contain passwords, tokens and customer data. Add production sinks with diagnose=False, or start the app with LOGURU_DIAGNOSE=NO for the default terminal sink.
05 · Standard library
Loguru and the logging module
Send library logs through Loguru
Libraries like requests, SQLAlchemy and uvicorn log with the standard logging module, so their lines skip your Loguru sinks. The Loguru docs include a small handler that forwards them. Save it as intercept.py:
# intercept.py
import inspect
import logging

from loguru import logger


class InterceptHandler(logging.Handler):
    def emit(self, record: logging.LogRecord) -> None:
        try:
            level = logger.level(record.levelname).name
        except ValueError:
            level = record.levelno

        # Report the line that called logging, not a line inside the logging module.
        frame, depth = inspect.currentframe(), 0
        while frame is not None and (depth == 0 or frame.f_code.co_filename == logging.__file__):
            frame = frame.f_back
            depth += 1

        logger.opt(depth=depth, exception=record.exc_info).log(level, record.getMessage())


logging.basicConfig(handlers=[InterceptHandler()], level=0, force=True)
Import it once, first thing at startup, and lines from Loguru and from libraries come out of the same sinks:
# main.py
import logging

import intercept  # noqa: F401
from loguru import logger

logger.info("From Loguru")
logging.getLogger("payments.client").warning("Retrying %s", "ord_123")
2026-10-22 20:42:11.692 | INFO | __main__:<module>:7 - From Loguru
2026-10-22 20:42:11.692 | WARNING | __main__:<module>:8 - Retrying ord_123Loguru vs the logging module
| Task | Loguru | logging |
|---|---|---|
| First log line | from loguru import logger | basicConfig(), then getLogger(__name__) |
| Rotating log files | rotation and retention on add() | RotatingFileHandler |
| JSON output | serialize=True | A custom Formatter or a third-party package |
| Context fields | bind(), contextualize() | extra= on each call, or a LoggerAdapter |
| Used by libraries | Rarely | Nearly all of them |
Writing a package that other people install? Log with the standard logging module there, so the apps that use it decide where its logs go. Use Loguru in your own apps.
06 · OpenTelemetry
Send Loguru logs to OpenTelemetry
OpenTelemetry is an open standard for sending logs, traces and metrics to an observability tool. With the setup below, your Loguru lines go to any backend that accepts OTLP, the OpenTelemetry protocol, and each line carries the ID of the request that wrote it. The example sends to Maple.
OpenTelemetry's Python SDK reads logs from the standard logging module, not from Loguru. The setup adds one Loguru sink, a bridge, that passes each line on:
Install and configure
pip install loguru \
    opentelemetry-sdk \
    opentelemetry-exporter-otlp-proto-http \
    opentelemetry-instrumentation-logging
Create telemetry.py. It names your service, points OpenTelemetry at your backend, and adds the bridge. The traces part is there for the request IDs: a trace records one request, and every line logged during it carries the trace's ID.
# telemetry.py
import logging

from loguru import logger
from opentelemetry import trace
from opentelemetry._logs import set_logger_provider
from opentelemetry.exporter.otlp.proto.http._log_exporter import OTLPLogExporter
from opentelemetry.exporter.otlp.proto.http.trace_exporter import OTLPSpanExporter
from opentelemetry.instrumentation.logging.handler import LoggingHandler
from opentelemetry.sdk._logs import LoggerProvider
from opentelemetry.sdk._logs.export import BatchLogRecordProcessor
from opentelemetry.sdk.resources import Resource
from opentelemetry.sdk.trace import TracerProvider
from opentelemetry.sdk.trace.export import BatchSpanProcessor

ENDPOINT = "https://ingest.maple.dev"
HEADERS = {"authorization": "Bearer YOUR_INGEST_KEY"}
resource = Resource.create({"service.name": "checkout"})

# Traces: give each request a trace ID that its log lines can carry.
tracer_provider = TracerProvider(resource=resource)
tracer_provider.add_span_processor(
    BatchSpanProcessor(OTLPSpanExporter(endpoint=f"{ENDPOINT}/v1/traces", headers=HEADERS))
)
trace.set_tracer_provider(tracer_provider)

# Logs: OpenTelemetry's LoggingHandler sends logging records to the backend.
logger_provider = LoggerProvider(resource=resource)
logger_provider.add_log_record_processor(
    BatchLogRecordProcessor(OTLPLogExporter(endpoint=f"{ENDPOINT}/v1/logs", headers=HEADERS))
)
set_logger_provider(logger_provider)

otel_logger = logging.getLogger("loguru.otel")
otel_logger.setLevel(logging.DEBUG)
otel_logger.propagate = False  # send these records to the backend only
otel_logger.addHandler(LoggingHandler(logger_provider=logger_provider, log_code_attributes=True))


# The bridge: a Loguru sink that turns each line into a logging record.
def otel_sink(message):
    record = message.record
    log_record = otel_logger.makeRecord(
        record["name"],
        record["level"].no,
        record["file"].path,
        record["line"],
        record["message"],
        (),
        record["exception"],
        func=record["function"],
        extra=record["extra"],
    )
    log_record.levelname = record["level"].name
    otel_logger.handle(log_record)


logger.add(
    otel_sink,
    level="INFO",
    # Don't send the SDK's own log lines back through the exporter.
    filter=lambda record: not record["name"].startswith("opentelemetry"),
)
For Maple, replace YOUR_INGEST_KEY with the private ingest key from the Ingestion page in Maple's settings; organizations in the EU region use https://ingest.eu.maple.dev. For another backend, change ENDPOINT and HEADERS: a local OpenTelemetry Collector, for example, listens on http://localhost:4318 and needs no header.
Run it
Import telemetry once, before the first log call. A trace is made of spans, one per step of the request. Web framework instrumentation starts a span for each request; this example starts one by hand:
# app.py
import telemetry  # noqa: F401
from loguru import logger
from opentelemetry import trace

tracer = trace.get_tracer("checkout")

with tracer.start_as_current_span("POST /checkout"):
    logger.info("Checkout started")
    logger.bind(order_id="ord_123").info("Charging card")
    logger.warning("Retrying webhook")
    logger.success("Payment captured")
$ python app.py
2026-10-22 21:29:31.448 | INFO | __main__:<module>:9 - Checkout started
2026-10-22 21:29:31.448 | INFO | __main__:<module>:10 - Charging card
2026-10-22 21:29:31.448 | WARNING | __main__:<module>:11 - Retrying webhook
2026-10-22 21:29:31.448 | SUCCESS | __main__:<module>:12 - Payment captured
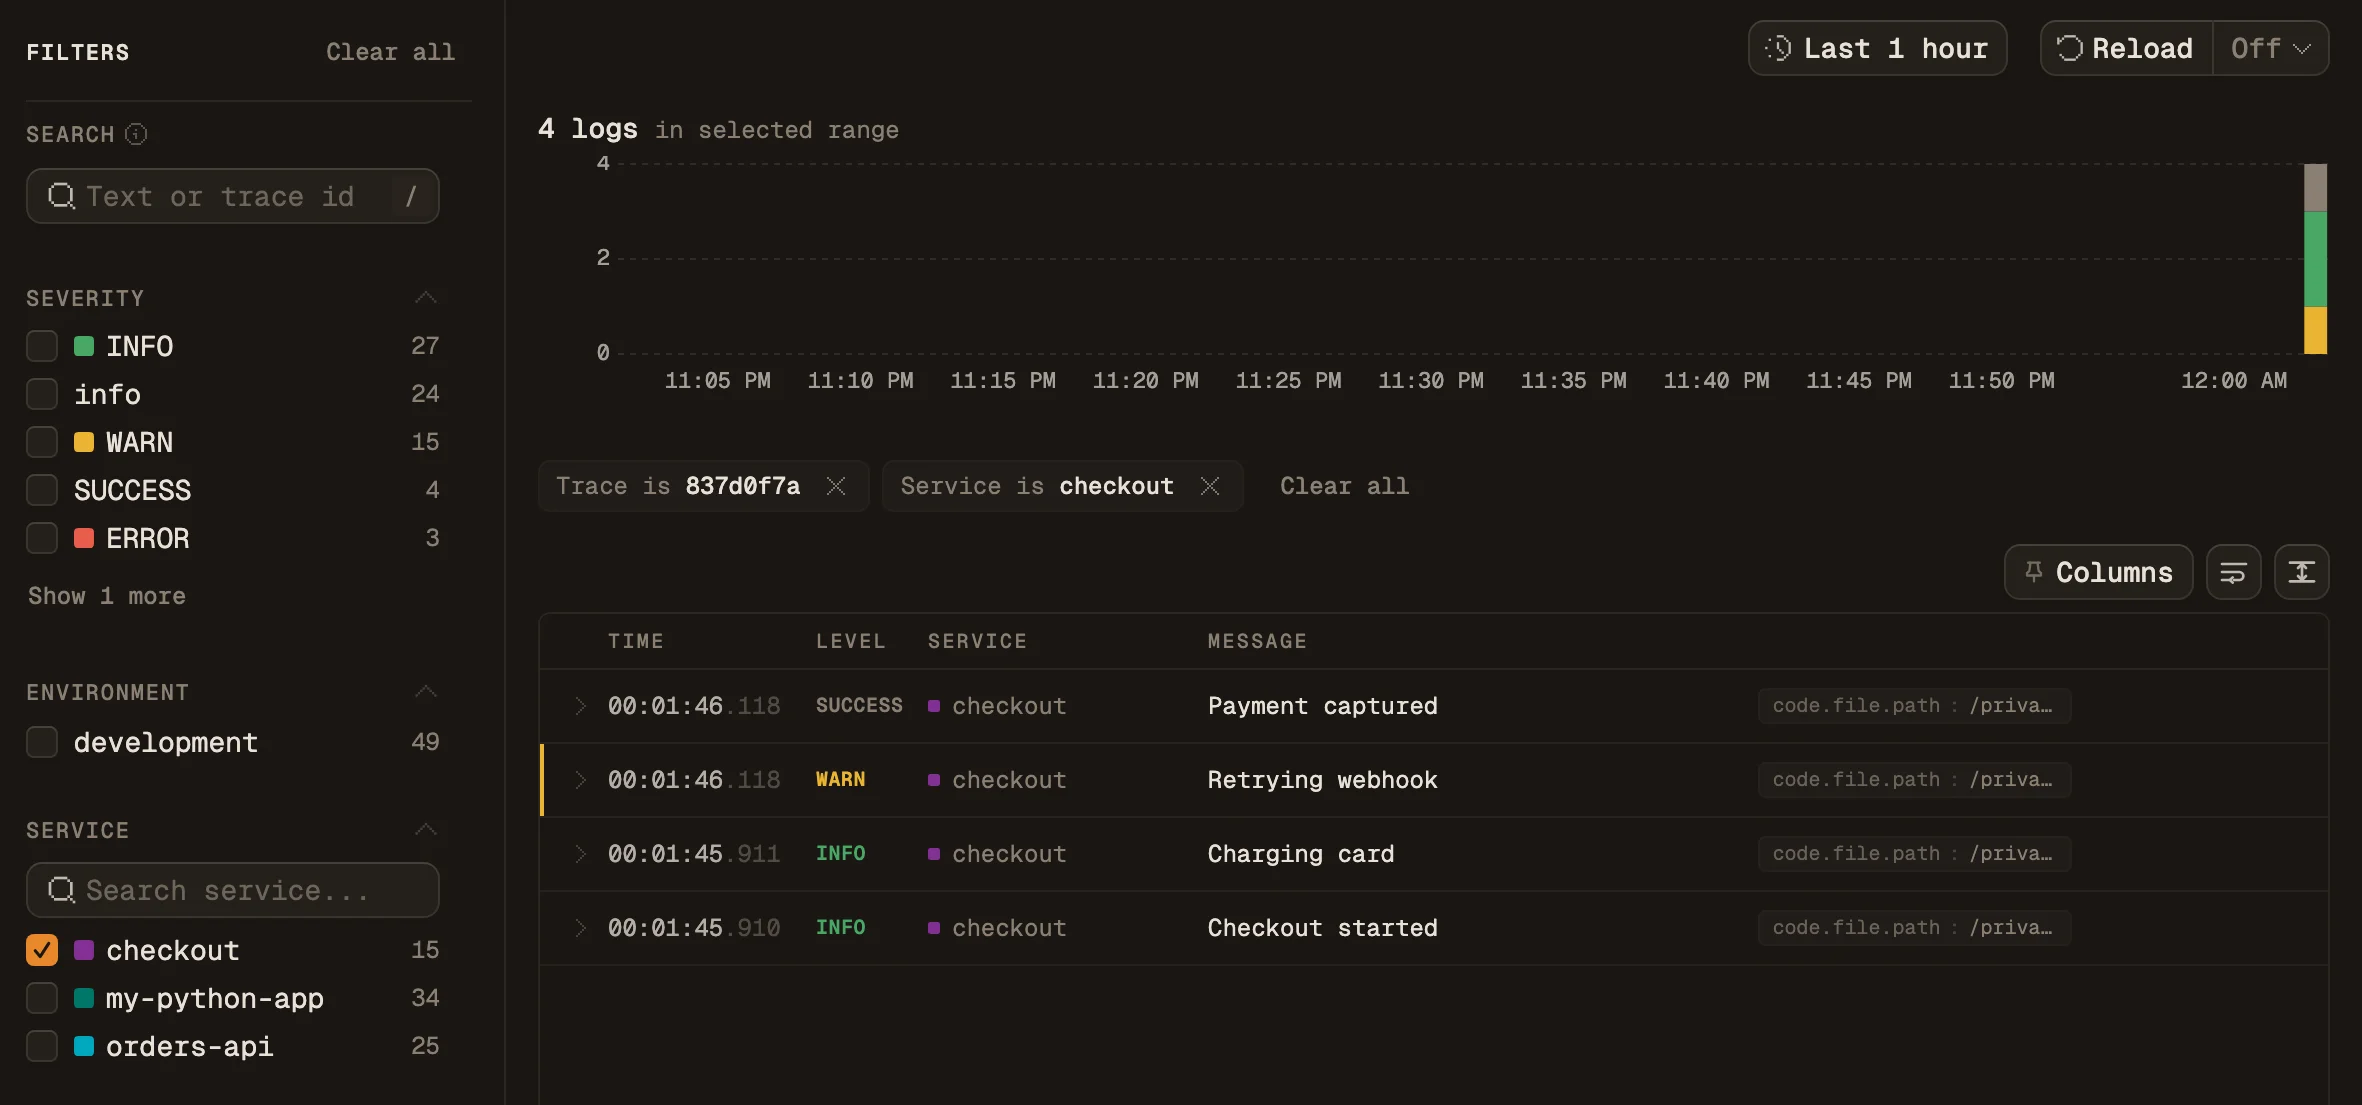
The terminal shows the four lines. The backend receives them too, all with the trace ID of POST /checkout, and order_id from bind() arrives as a field on its line. The SDK sends lines in batches about once a second and sends the rest when the program exits.
Using intercept.py? Import it before telemetry, and library logs reach the backend through the same bridge. The exporter's HTTP client then logs each upload to your terminal at DEBUG; logging.getLogger("urllib3").setLevel(logging.WARNING) hides those lines.
Two ways to lose the request ID
- Adding
otel_sinkwithenqueue=True, Loguru's option to write from a background thread. That thread is outside the request, so the trace ID arrives as all zeros. - A
bind()key thatloggingalready uses, such asname,moduleormessage.loggingrejects it and the line never reaches the backend. Use names likeuser_name.
See the logs in Maple
- 01
Find the lines
Open Logs and pick your service under Service in the sidebar. Paste a trace ID into Search to list every line from one request.
- 02
Open a line
Click a row, then Open detail. Bound values such as
order_idand the file, function and line that logged it are under Log Attributes. Thetrace:link opens the request the line belongs to.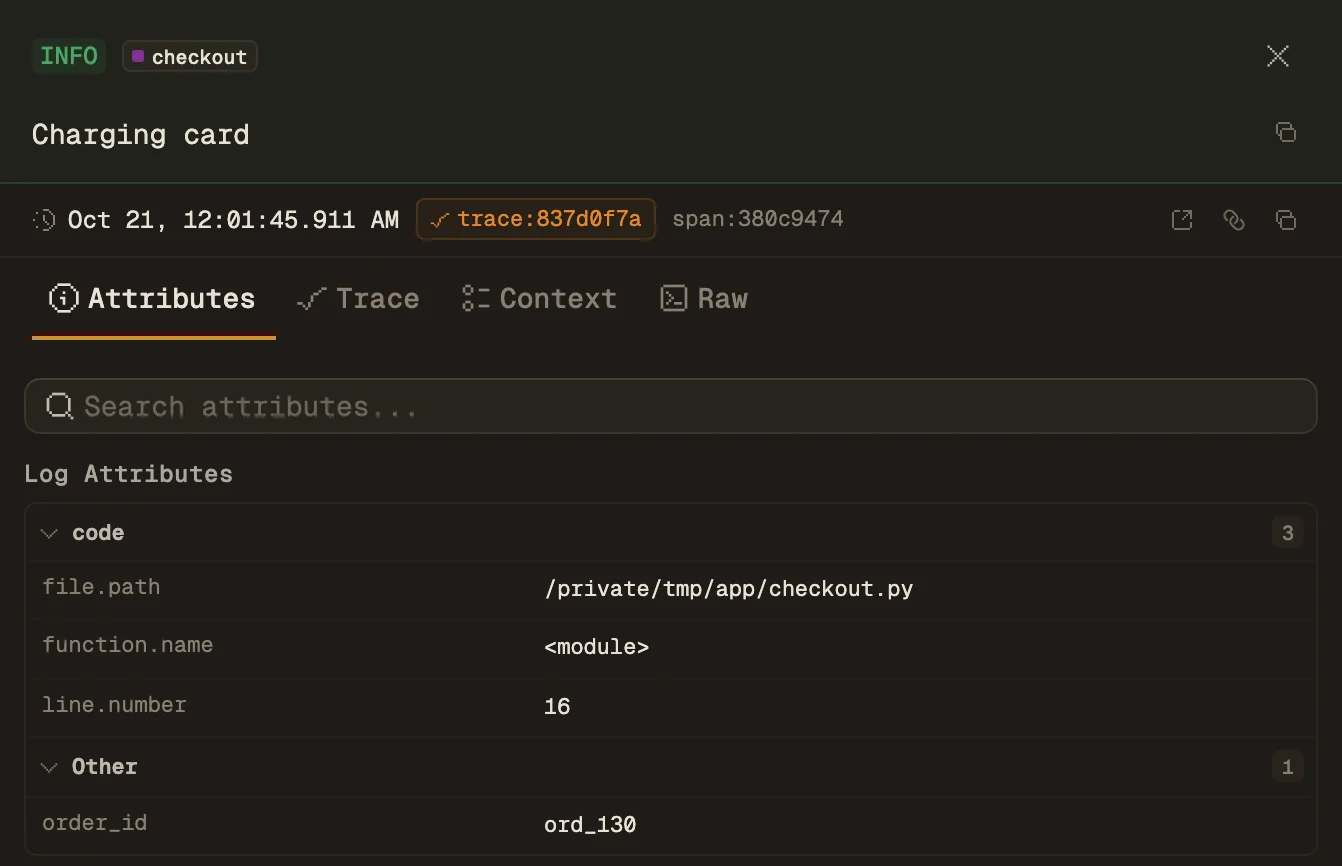
Loguru logs in Maple
Send your first Loguru line
For traces and metrics from the same app, see the Python guide.
Sources and further reading